(-) Existing home sales for December fell by -1.0%, which ran contrary to an expected +1.2% gain, and obviously was a bit of a disappointment. Single family home sales dropped by -1.4%, which were offset somewhat by condo sales, which gained +1.7%. From a regional level, weakness in the Midwest (nearly -6%) and South overwhelmed gains in the Northeast and Western portions of the country. Net-net, a choppy report, but not entirely surprisingly considering the time of year we’re in.
(0) The FHFA home price index, that takes into account prices of homes with Fannie Mae/Freddie Mac mortgages, gained +0.6% for November, which just fell short of consensus by a tenth of a percent. The Pacific and Mountain regions experienced gains near two percent, and drove the broader upward movement. The more critical measure, year-over-year price movement, registered a gain of +5.6%, making 2012 the first positive year in six years.
(-) New home sales for December were lower than expected in December, falling -7.3% month-over-month, which ran counter to an expected consensus gain of +2.1%. Some of this difference was due to some revisions for November (the gain for which was boosted from +4.5% to over +9%), but the volatility is typical of this series and this time of year. Year-over-year, sales are up +9%, which is positive.
The new home sales story has been a positive one, and may very well contribute meaningfully to U.S. GDP in 2013—inching further towards normal after plodding along at very low levels for years coincident with the financial crisis. In fact, it could add up to a large percentage of the total GPP number—which, in the slow growth period we’re in, is meaningful. There are other effects as well, such as indirect demand for household goods and a general improvement in the ‘wealth effect’ that helps consumers feel richer and better able to spend (since their homes are worth more).
(-) The Richmond Fed manufacturing index fell to a -12 for January from a positive +5 in December. The report showed general weakness in all areas, including shipments, orders and capacity utilization, as well as employment and workweek length. However, prices paid/received continued at moderate levels, reflecting the tempered inflation environment. Sentiment from survey participants about look-ahead conditions also improved a bit from lower levels pre-fiscal cliff concerns at year-end, which was a bright spot in the result.
(+) Initial jobless claims came in much lower than expected for the Jan. 19 ending week at 330k, which was far below the 355k expected. However, this may be at least partially due to a continued anomaly as a result of year-end ‘distortions’ and other seasonal adjustment factors, according to the DOL. (Their commentary is typically a bit vague, but this is the time of year when hiring/firing activity accelerates, so figures are a little fuzzy.) Continuing claims for the Jan. 12 week came in at 3,157k, which was a bit lower than the 3,200k expected. Note that, due to the holidays, claims for nine states were calculated using estimated data, which corrupts the results somewhat. Nonetheless, the trend for both series has been moving lower—a positive sign for the job market.
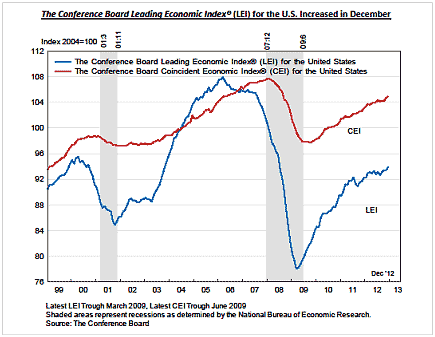
(+) The Conference Board’s indexes of economic indicators were released for December, with less fanfare these days it seems. The leading economic index rose 0.5% to 93.9, which was an improvement on an unchanged reading from the month prior. Results were led by better numbers in employment claims, building permits and credit (two-thirds of all indicators were positive), while consumer expectations and manufacturing new orders remained weak. The coincident and lagging indicators also rose over the month. The leading index certainly picked up speed over the second half of 2012 compared to a slower increase during the first half. The longer-term trendline has moved in an upward trajectory since the financial crisis—as seen in the chart below.
The Bank of Japan this week further expanded their inflation target from 1% to 2%, in line with efforts to expand their economy and recent political rhetoric. For a sense of perspective, their core CPI over the past twelve months is currently -0.6%, which is certainly deflationary as opposed to inflationary, and problematic from the perspective of growth generations prospects. So, this is where the new inflation target originated from. So far, markets believe it, and the Yen has fallen almost 10% against the dollar in the past month, and Nikkei stock index is up just over 10% as tougher language and an asset-purchase program (like ours) has been announced. However, the last time inflation has reached the 2% level in Japan on a year-over-year basis was 1997—this may be a long road.
Question of the Week (an occasional feature)
I keep hearing about currencies? What does this mean and why are they so volatile?
The financial news often reports about what’s just happened or newsworthy comments made by various policymakers. Of course, some is overblown but there is often a shred of truth to the underlying story. Currency futures have always been volatile.
A long-running theme in global economic development in recent years (decades, actually) is the general improvement in the fiscal balance sheets and credibility of emerging market nations like Brazil and Malaysia, and the balance sheet deterioration of ‘developed’ nations of Western Europe, Japan and the United States. This effect would be more pronounced if it weren’t for the legacy of ‘stability’ the developed nations historically that has kept their currencies and bond interest rates lower than they normally would be.
Currencies seem mysterious because of their nature—there is no absolute method for consistently measuring their value (there are some theoretical models, such as ‘purchasing power parity,’ but even these are unreliable, especially over the short-term). On a relative side, currencies only have value based on the confidence a depositor/investor/citizen has in that nation’s government or central bank policies outright as well as relative to other nations’ currencies, i.e. Japanese Yen vs. U.K. Pound, Euro vs. Brazilian Real. Aside from basic national stability (which is why developed nations tend to have more ‘expensive’/stronger currencies than traditionally-less-stable emerging market nations). Currencies are a product with supply/demand characteristics like any other, just more nuanced.
Factors than can strengthen a nation’s currency value:
- ‘Legitimate’/stable regime (such as a pro-Western style democracy or at least a trustworthy government) and track record of paying their bills in a timely and willingness to continue to do so;
- Capable monetary policy with sufficient central bank independence and ability to keep inflationary forces in check;
- Economic growth, which can include a strong industrial/service base or abundant natural resources;
- Good fiscal conditions and/or lower levels of debt.
Factors than can weaken a nation’s currency value:
- Unstable government, or one that is anti-business or anti-developed world (a caveat: a poorly regarded but stable regime that still pays their bills can sometimes buck this trend);
- Defaulting on government debt (one-time or repeatedly, like Argentina);
- High levels of debt in general—which can raise chances for a future default;
- High inflation, which erodes currency value, either by itself or coupled with a less credible central bank;
- Low or unrealized economic growth, or resources that can’t be fully taken advantage of due to any of the conditions noted above.
Other factors:
- A cheaper/weaker currency can help a nation by making their exports cheaper, so industries are more competitive with foreign manufacturers. This is why many governments are pressured to ‘devalue’ their currencies, as long as it’s done in a moderate way and doesn’t affect citizens’ purchasing power in the short run.
- A stronger currency, especially in the case of an emerging market, can be a source of national pride and reinforcement that the nation has ‘arrived,’ so to speak.
This issues can get murky, such as the case of Japan—which is seen as a global manufacturing powerhouse with a stable governmental system (despite frequent PM changes) and high levels of debt, mainly held internally by the Japanese people. During the financial crisis, their ‘safe haven’ status pushed the Yen higher than perhaps it should have been due to this legacy. As Prime Minister Abe has announced stimulus plans and a goal of higher growth and inflation targets, the Yen has sold off in recent months—not a surprise, considering inflation should erode a currency’s value—if this policy works as intended. On the other hand, emerging market currencies are still in the process of earning that all-important trust. They’ve come a long way, but there is further to go.
This is a short summary, and we could obviously delve deeper into this topic. We may in future editions.
Market Notes
| Period ending 1/25/2013 |
1 Week (%) |
YTD (%) |
| DJIA |
1.80 |
6.17 |
| S&P 500 |
1.15 |
5.48 |
| Russell 2000 |
1.40 |
6.61 |
| MSCI-EAFE |
1.56 |
4.81 |
| MSCI-EM |
-1.08 |
1.32 |
| BarCap U.S. Aggregate |
-0.38 |
-0.61 |
| U.S. Treasury Yields |
3 Mo. |
2 Yr. |
5 Yr. |
10 Yr. |
30 Yr. |
| 12/31/2012 |
0.05 |
0.25 |
0.72 |
1.78 |
2.95 |
| 1/18/2013 |
0.08 |
0.26 |
0.77 |
1.87 |
3.03 |
| 1/25/2013 |
0.08 |
0.28 |
0.87 |
1.98 |
3.14 |
This week, the S&P gained for the fourth straight week and made its way to a 5-year high.
The 1500 on the S&P isn’t anything magical but investors do tend to place some weight on round numbers and special mileposts like this, especially when they pop up in the national news. After our strong run as of late, are we due for a correction? Not necessarily, since valuations remain reasonable and growth is present. But, a pullback of some sort is never out of the realm of possibility—of course, it would just be handy to know when and where. Absent that, conditions continue to improve and look positive for risk assets looking into 2013. Importantly, none of the important negatives that signal danger in equity markets are present, like high P/E ratios or excessive euphoria (quite the opposite, in fact). This is true on an outright basis, but even more so relative to other asset classes like fixed income looking ahead.
From a sector perspective, consumer discretionary and financial stocks led, while technology (the only sector with a negative return on the week) and consumer staples lagged the index by the greatest amounts. Google and IBM had especially good weeks on earnings surprises. Apple, however, lost -10% just after its disappointing iPhone sales numbers were released (although final earnings were above consensus and the iPad seemed to be plugging along as expected).
In the foreign markets, developed nations were higher in line with U.S. equities, led by gains in while several core Euro nations like Germany (in which consumer sentiment has improved) as well as France and Spain, while emerging nations such as China and India lagged.
Bonds were mixed with slower issuance due to a holiday week, but credit (high yield and bank loans in particular) outperformed governments overall, which helped the performance of our portfolios. Emerging market-led international also fared well in relative terms, while foreign developed markets were roughly flat.
Commodity markets were led by strong returns in industrial metals—particularly, lead and zinc. Precious metals and natural gas lost the greatest amounts during the week—roughly 2%.
Have a good week.
Karl Schroeder, RFC
Investment Advisor Representative
Schroeder Financial Services, Inc.
480-895-0611
Sources: FocusPoint Solutions, Associated Press, Barclays Capital, Bloomberg, Deutsche Bank, FactSet, Goldman Sachs, JPMorgan Asset Management, Morgan Stanley, MSCI, Morningstar, Northern Trust, Oppenheimer Funds, Payden & Rygel, PIMCO, Thomson Reuters, Schroder’s, Standard & Poor’s, The Conference Board, U.S. Bureau of Economic Analysis, U.S. Federal Reserve, Wells Capital Management, Yahoo!, Zacks Investment Research. Index performance is shown as total return, which includes dividends, with the exception of MSCI-EM, which is quoted as price return/excluding dividends. Performance for the MSCI-EAFE and MSCI-EM indexes is quoted in U.S. Dollar investor terms.
The information above has been obtained from sources considered reliable, but no representation is made as to its completeness, accuracy or timeliness. All information and opinions expressed are subject to change without notice. Information provided in this report is not intended to be, and should not be construed as, investment, legal or tax advice; and does not constitute an offer, or a solicitation of any offer, to buy or sell any security, investment or other product. Schroeder Financial Services, Inc. is a registered investment advisor.
Notes key: (+) positive/encouraging development, (0) neutral/inconclusive/no net effect, (-) negative/discouraging development.